Project Design
1. Introduction
Section titled “1. Introduction”This section documents the technical design of Sports Live Tracker.
It includes architecture, diagrams, UI/UX artifacts, data models, and deployment design, ensuring a well-structured and scalable application.
2. System Architecture
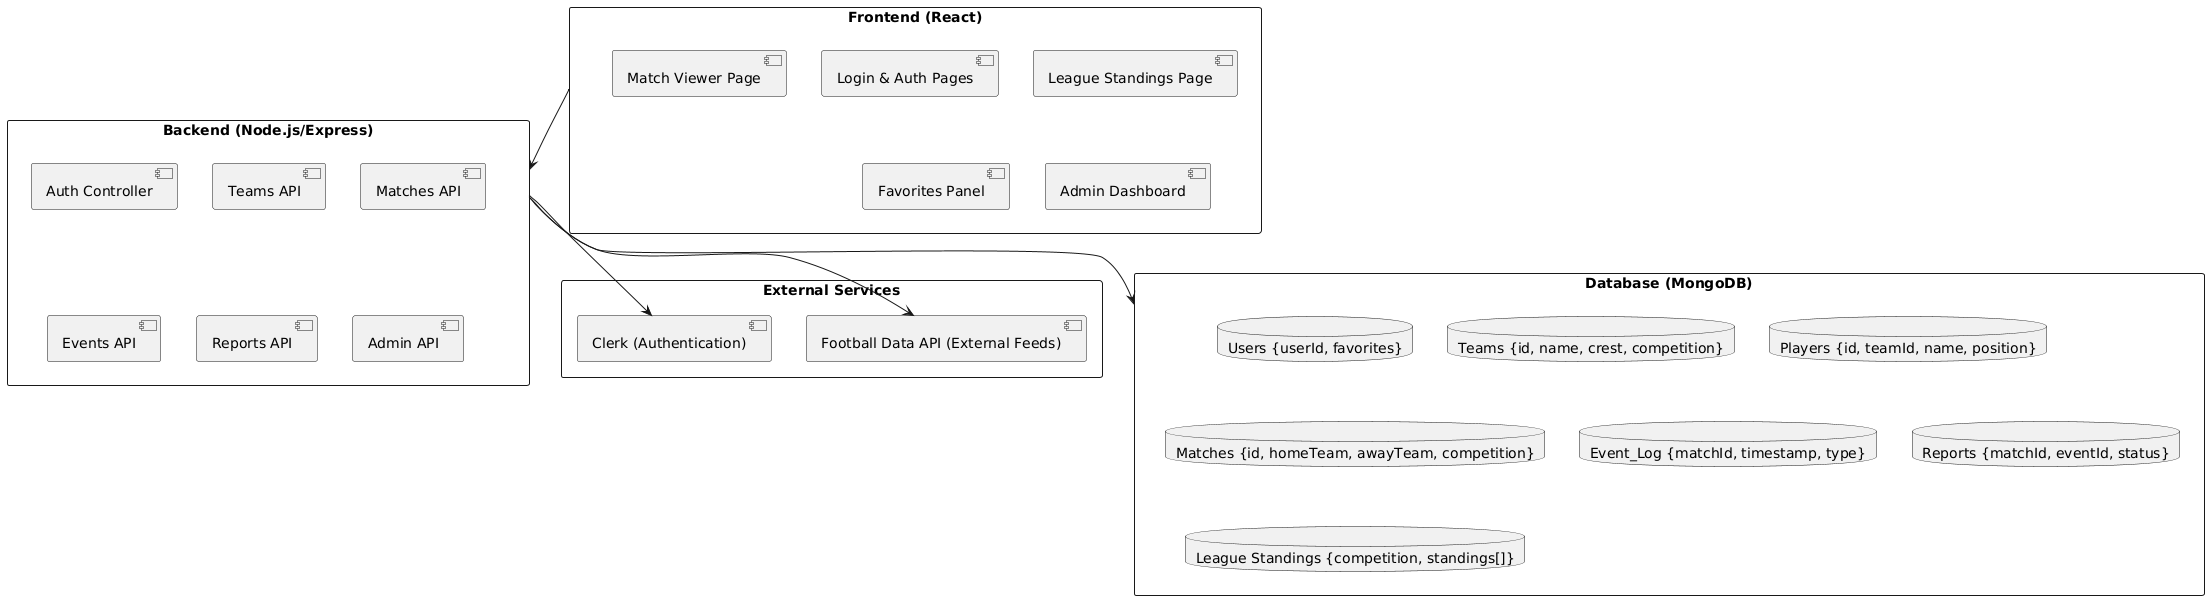
Section titled “2. System Architecture”- Frontend (React + Tailwind) → User interface (dashboard, matches, standings).
- Backend (Node.js + Express) → APIs for authentication, matches, standings.
- Database (MongoDB Atlas) → Persistent storage of users, matches, teams, events.
- External API (https://www.football-data.org/) → Fetch additional football data.
- Deployment (Render) → Hosts frontend + backend services.
📌 Diagram:
3. Data Flow
Section titled “3. Data Flow”- User interacts with React frontend.
- Frontend sends requests to Express backend.
- Backend retrieves data from MongoDB or AllSportsAPI.
- Updates pushed to UI in real-time via WebSockets.
4. UI Design Artifacts
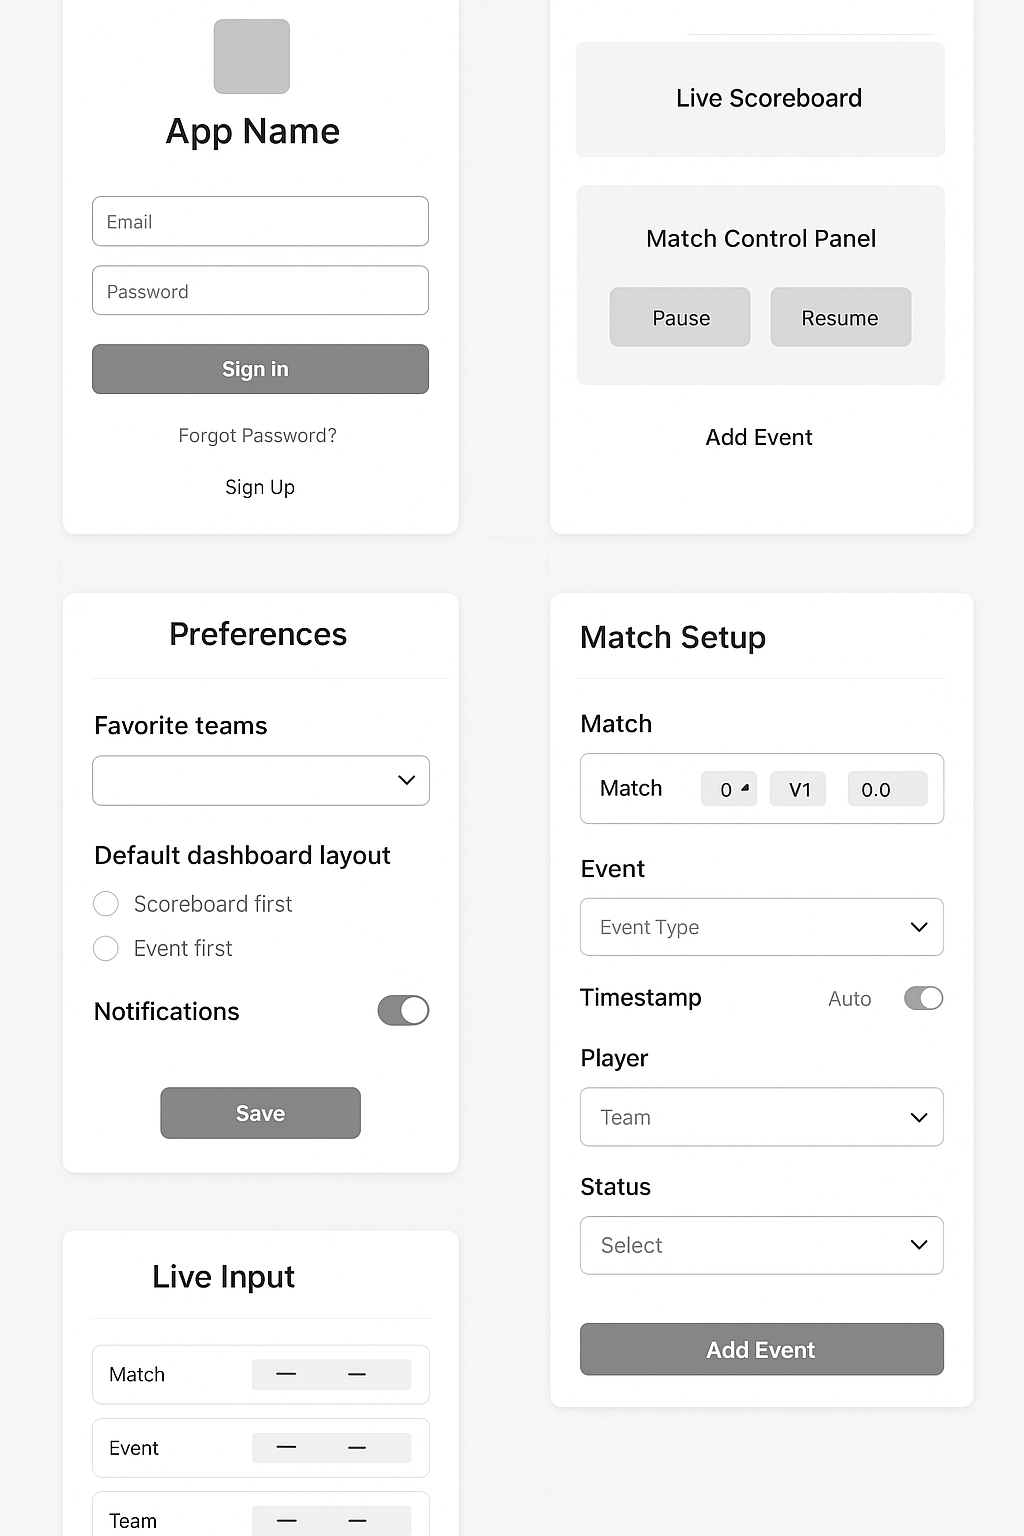
Section titled “4. UI Design Artifacts”We created wireframes in Figma before coding.
Main Screens
Section titled “Main Screens”- Login & Registration → Simple Clerk-based authentication.
- Dashboard → Shows live matches + league standings.
- Match Viewer → Timeline of goals, cards, and events.
- Admin Match Setup → Create, edit, and delete matches.
- League Tables → View standings by competition.
📌 Wireframes:
5. UML Diagrams
Section titled “5. UML Diagrams”5.1 Use Case Diagram
Section titled “5.1 Use Case Diagram”Shows how admins, viewers, and guests interact with the system.
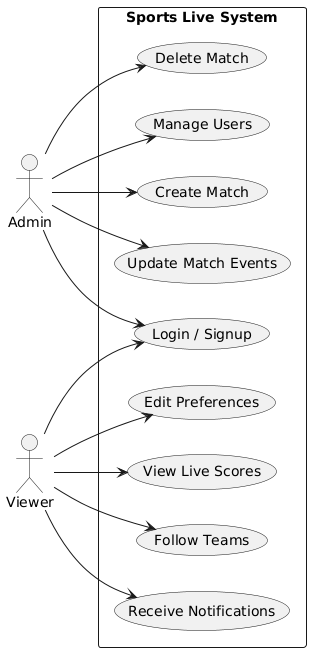
- Admin → Add/edit/remove matches, manage events.
- Viewer → View live scores, standings, follow teams.
- Guest → Access public matches.
5.2 Component Diagram
Section titled “5.2 Component Diagram”High-level breakdown of frontend + backend layers.
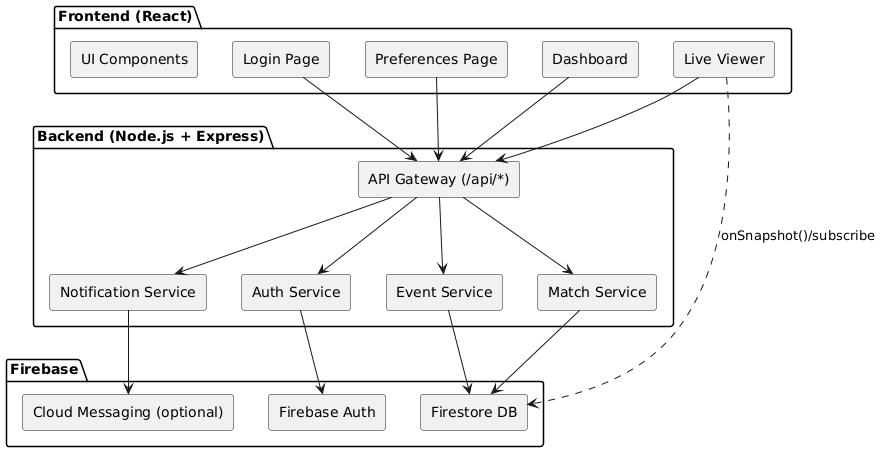
- Frontend (React) → Pages, reusable components (MatchCard, ScoreBoard).
- Backend (Express) → Auth service, match service, event service.
- Database (MongoDB) → Collections: users, matches, teams, events, standings.
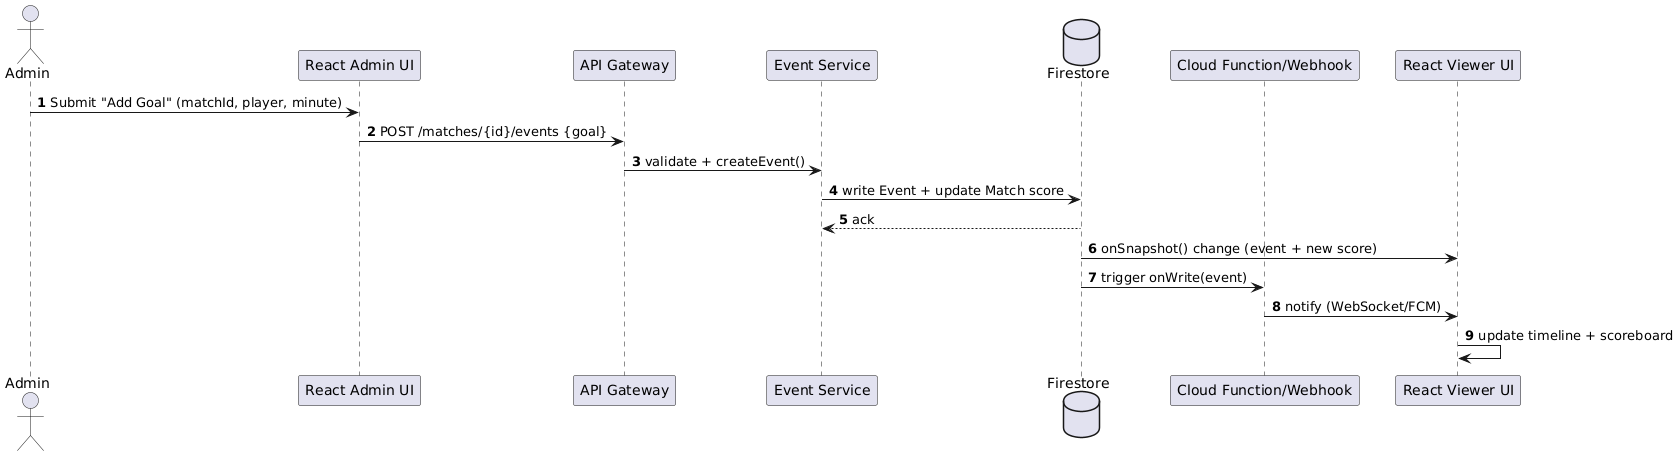
5.3 Sequence Diagram
Section titled “5.3 Sequence Diagram”Example: Admin adds a goal → update propagates in real time to viewers.
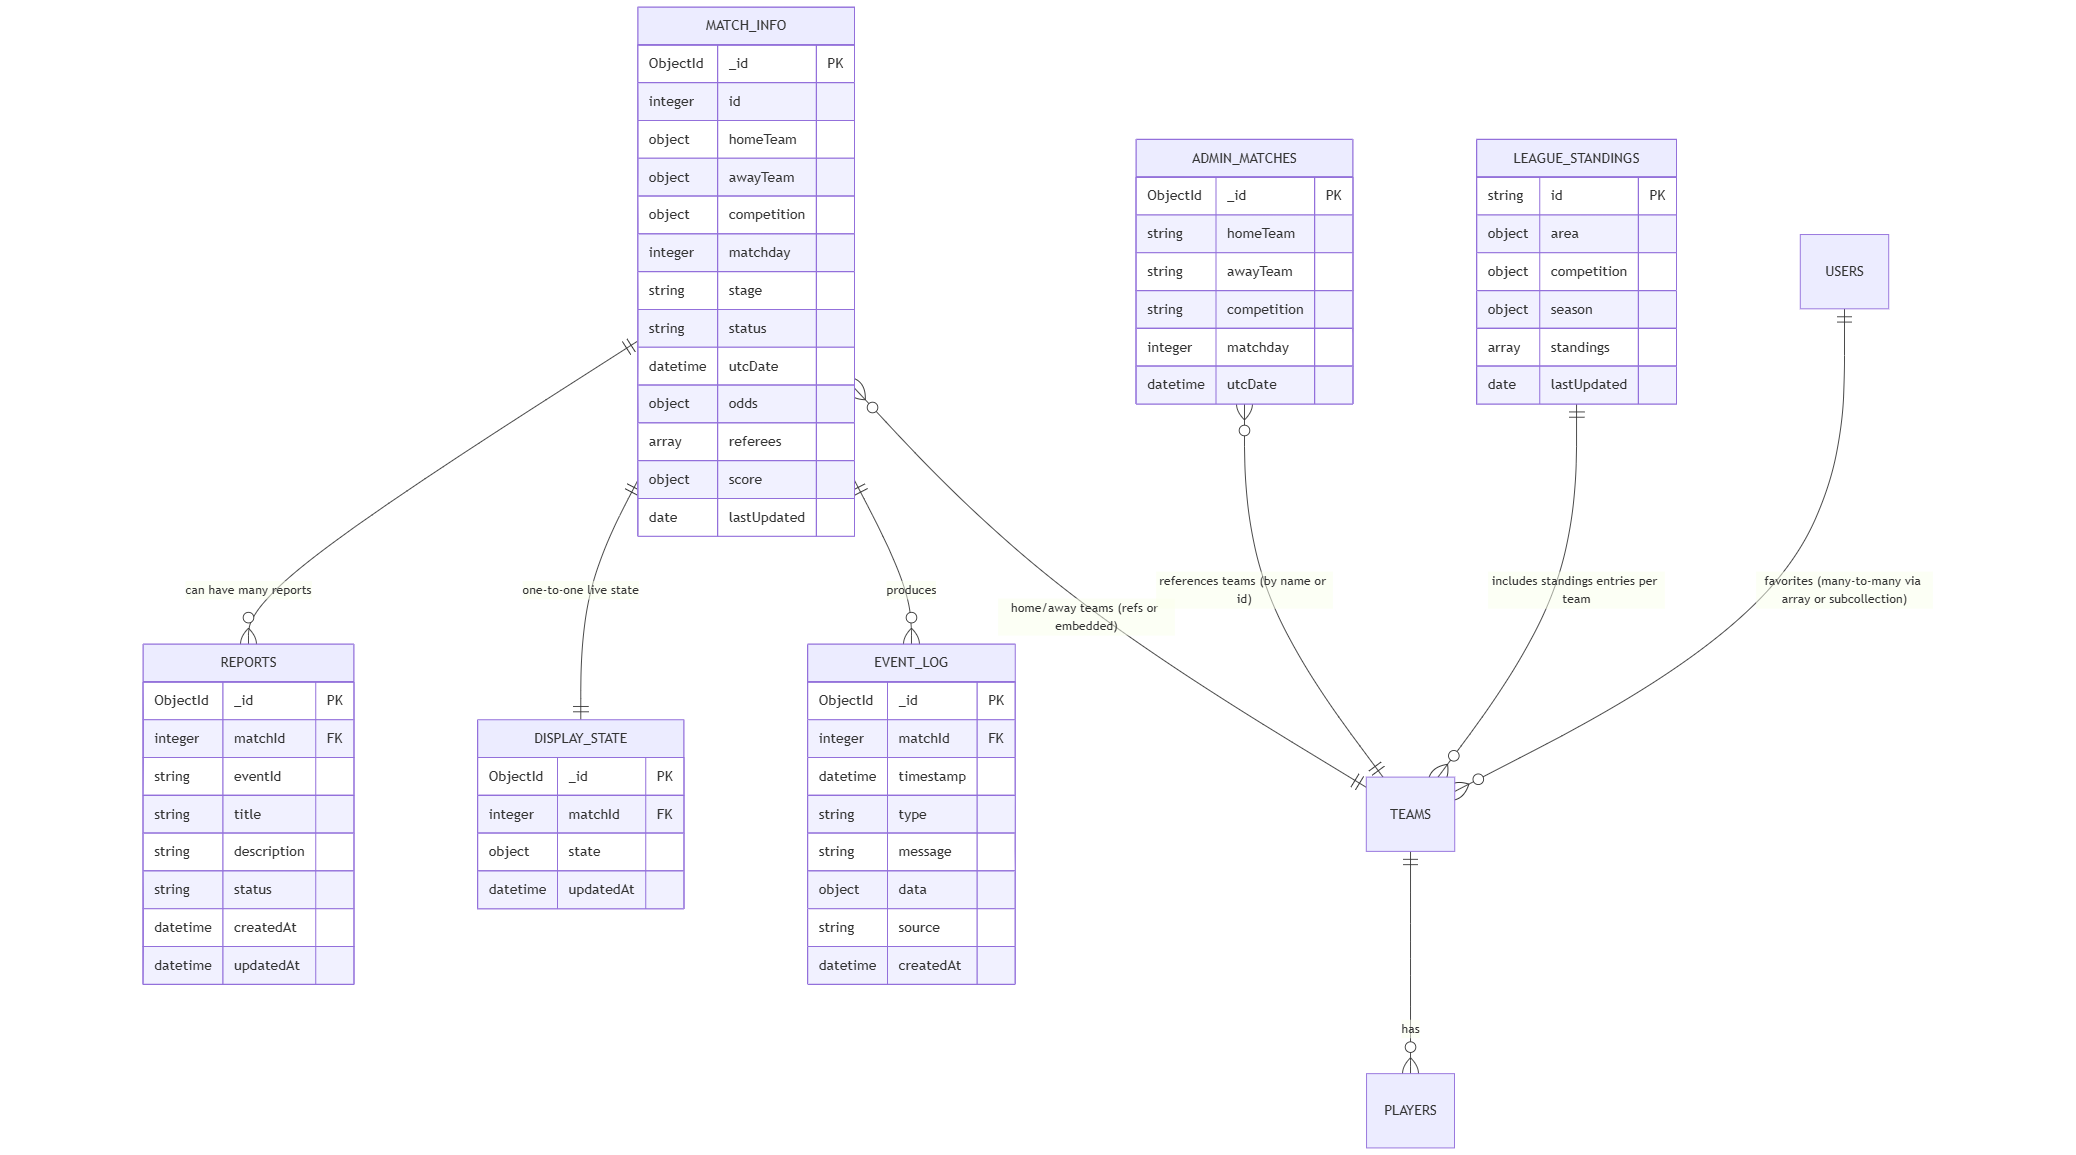
6. Data Model (ER Diagram)
Section titled “6. Data Model (ER Diagram)”Entities: User, Team, Match, Event, Player, Standing.
- User → { id, name, email, role }
- Team → { id, name, league, crest }
- Match → { id, teamA, teamB, score, status }
- Event → { id, matchId, type, player, minute }
- Standing → { leagueId, teamId, points, position }
📌 ER Diagram:
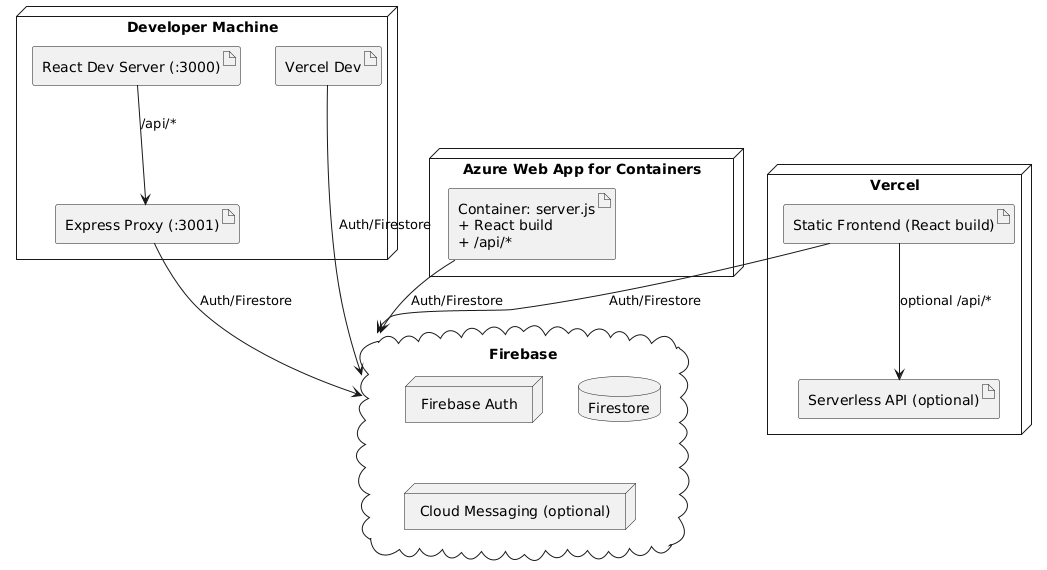
7. Deployment Diagram
Section titled “7. Deployment Diagram”- Local Development → React + Express + MongoDB (Docker optional).
- Cloud Deployment → Render (frontend & backend), MongoDB Atlas.
📌 Diagram:
8. Design Decisions & Notes
Section titled “8. Design Decisions & Notes”- Chose MongoDB for flexibility in handling match/event data.
- WebSockets for real-time updates → fallback polling in case of failure.
- Clerk Authentication instead of Firebase/Auth0 → easier integration + role-based access.
- League Standings added after feedback → required schema extension.
9. Continuous Design Evolution
Section titled “9. Continuous Design Evolution”- Wireframes refined after tutor feedback (Sprint 2).
- Database schema updated (added
standingscollection in Sprint 3). - Deployment optimized (moved from Vercel → Render for simplicity).
- Sequence diagram updated to reflect live events propagation.
10. Conclusion
Section titled “10. Conclusion”The design artifacts (wireframes, UML, ER models, architecture) provided the team with a blueprint for implementation.
By iterating on the design each sprint, the system stayed aligned with user needs, technical feasibility, and stakeholder feedback.
📅 Want to see how we scheduled and organized this work?
Check out the Project Planning Guide.